.svg)


Table of Contents
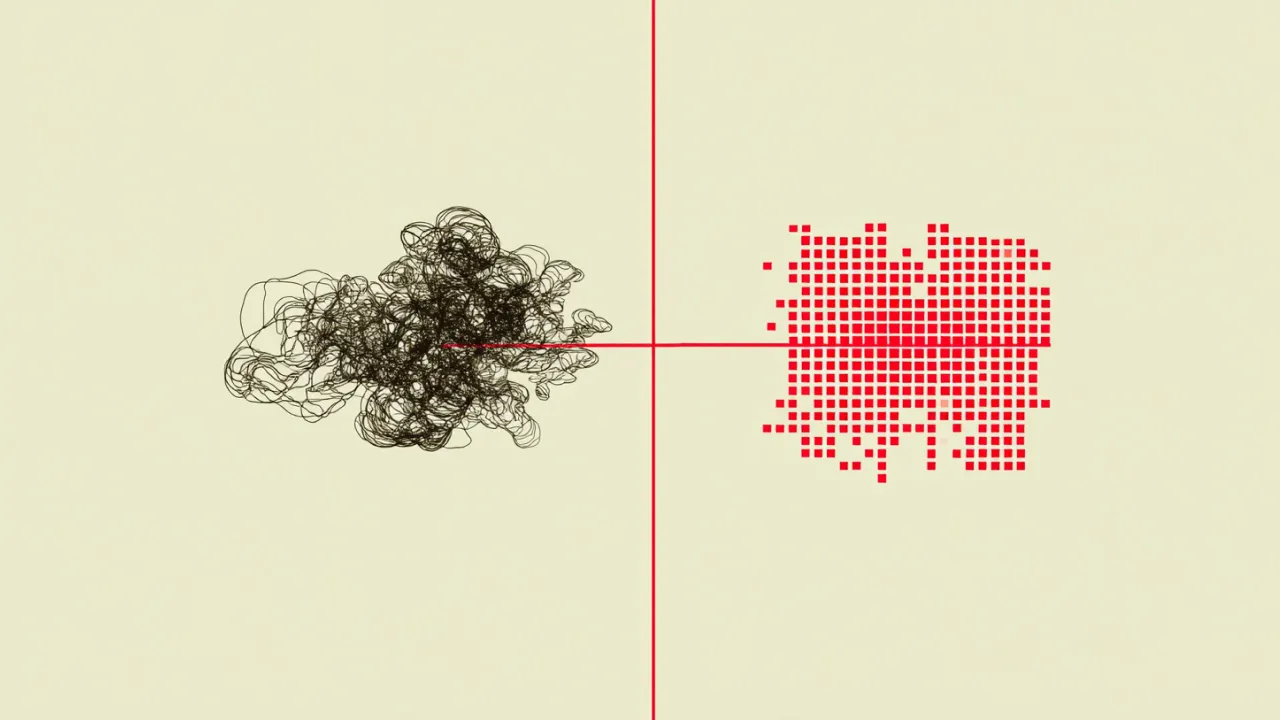
When choosing a document data extraction solution, being able to perform an insightful and unbiased benchmark among different providers is important before drawing conclusions. Depending on the type of solutions you are testing, or the problem you are trying to solve, the process might differ because there is no generic and absolute benchmark strategy. Most receipt Optical Character Recognition (OCR) technologies rely on statistical approaches (like machine learning or deep learning), and performing benchmarks on those technologies must follow some important guidelines in order to get meaningful and unbiased insights leading to a decision. How does a receipt OCR work?
Click below to download Mindee's free OCR benchmark tool and start your evaluation today!
Download the Free OCR Benchmark Tool
How does a receipt OCR work?
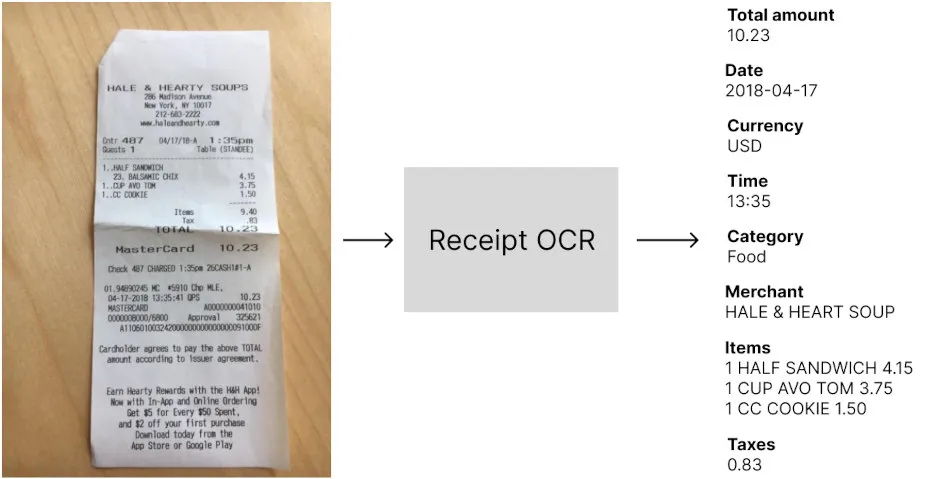
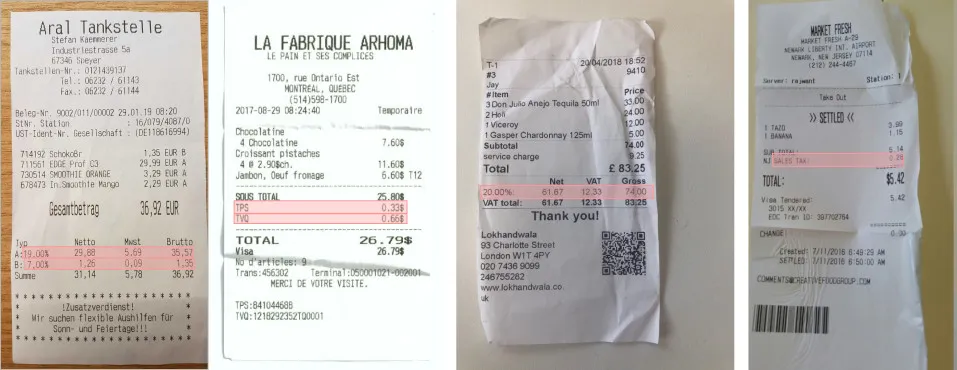
Receipt OCR technologies extract data from images of expense receipts in a machine-encoded format that can be used in software applications. They are mainly used to automatically extract data from receipts in order to optimize or automate a manual process. Depending on the technology, the list of extracted fields can differ, but the main data points usually extracted are the amounts, taxes, date and time, and supplier information.
Evaluating a receipt OCR has many aspects, like the set of extracted fields, the pricing, and the extra features. We’ll focus in this article on the most important part of the benchmark that can help you understand how well it will perform in your applications, the technical performances:
- Extraction performances: the goal is to measure the impact of the technology on the optimization of the manual data entry process. By testing the OCR, you want to understand how many times the OCR outputs the right answer for the total amount, the date, etc… In other words, you want to specify performance metrics like accuracy, automation rate, precision, or any other relvant metric that matches your business goal.
- Speed: most expense management solutions offer real-time user experiences and it’s important to make sure that users will not wait before the receipt data are extracted. This benchmark should help you understand how long your users would wait before the data is extracted.
But because most receipt OCRs are built using statistical approaches that don’t behave the same way depending on the data, it’s very important to choose carefully the set of receipts used for evaluation.
Create a meaningful set of receipts for testing the OCR
This is definitely the most important part of the process because depending on the dataset you send to the OCR you might have different results and you want to make sure you are testing the solution on the same scope as your usage. And worse, if your data set is too small, you can get a measure of the accuracy that is not even close to the real accuracy you will see in production.
In other words, when performing your benchmark, you want to get an accurate and unbiased estimation of the performances of the OCR if you were to use it on your real-world use case.
“It's easy to lie with statistics, but it's hard to tell the truth without them.”
― Charles Wheelan Naked Statistics: Stripping the Dread from the Data
How many receipts to use in order to get an accurate estimation of the performances?
The problem of not having enough data in your test set
The rule of thumb is “the more data, the more accurate the benchmark is”, but that’s not really actionable. This is actually a very difficult question! But statistics offer an easy way to think about this question differently.
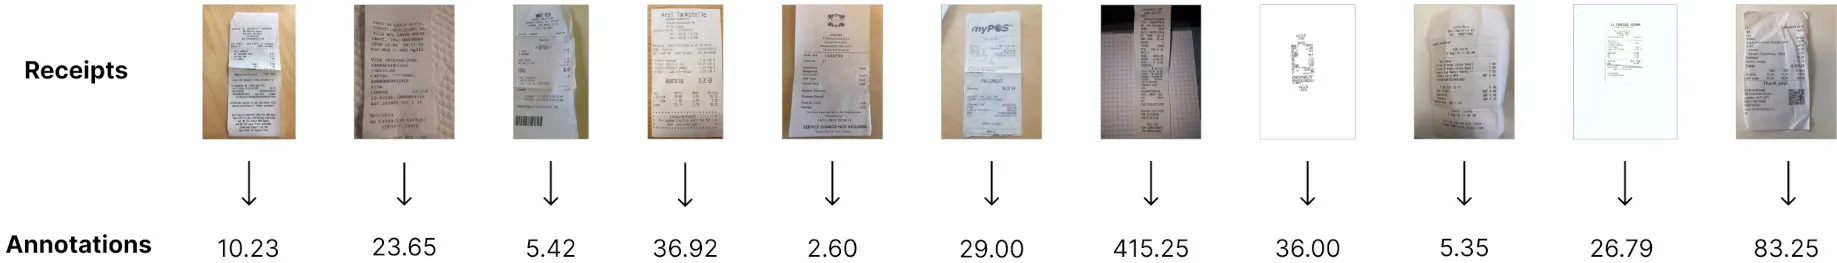
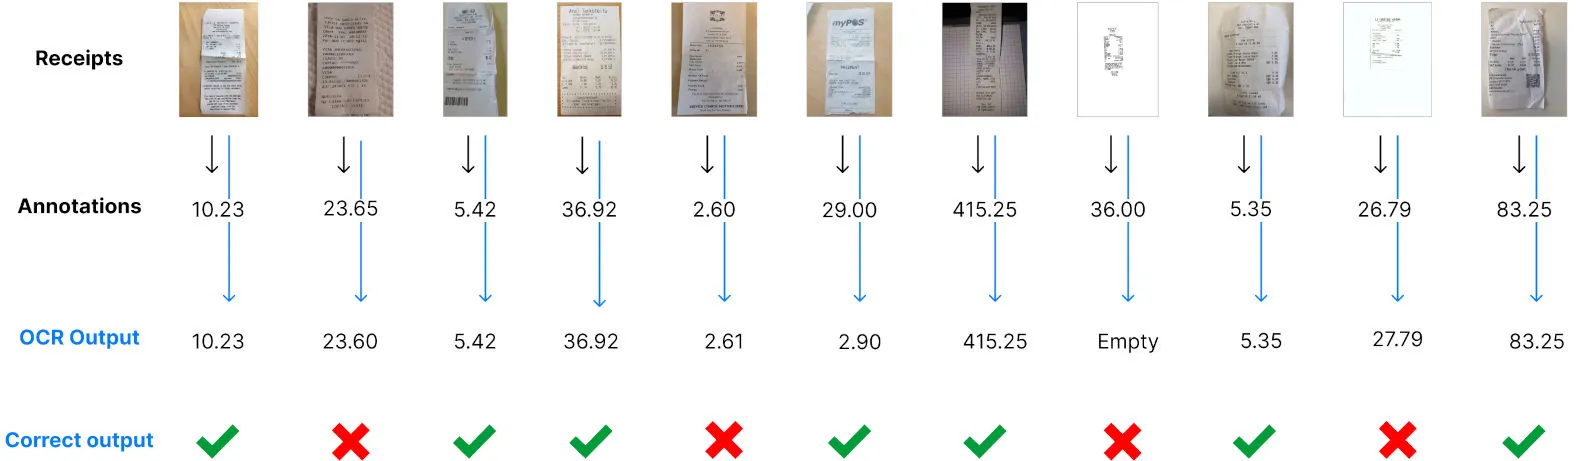
First, let’s think about a simple problem. You have 11 receipts in your data set, and for each of those receipts, you have the corresponding total amount that you’ve written in a spreadsheet (We’ll talk about this later: Annotating the receipt data set). An illustration of your data is something like this:
Now you want to know what is the average accuracy (we’ll define the different metrics later: What metrics are important to measure?) of the OCR on those data. This is quite simple, for every data in your data set, you need to run the OCR, and compare the total amount predicted by the receipt OCR with the “ground truth”. The percentage of right predictions of the OCR is the accuracy of the technology on your 11 data.
Let’s say that you obtain 64%. Does it mean that if you use at a large scale the OCR, for example with 150.000 receipts a month, you will know for sure that you will get a 64% accuracy as well? Of course not, and we need to understand how accurate is our measure.
Estimating the accuracy of the measure
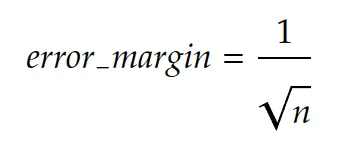
Statistics give us a way to know the error margin with a confidence of 95% of your measurement given the number of receipts you tested the OCR on. There is an approximate formula that is very simple:
In our example, we had 11 data in our test set. The error margin is then 30%:
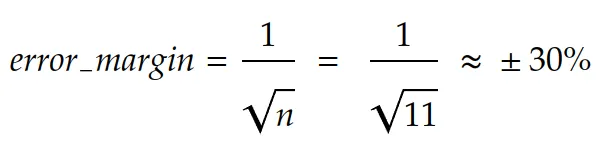
In other words, it’s very unlikely that you get 64% of accuracy on a large scale. In fact, the real information you get using these 11 test data is: The accuracy of the receipt OCR is between 33.9% and 94.1% with a confidence of 95%.
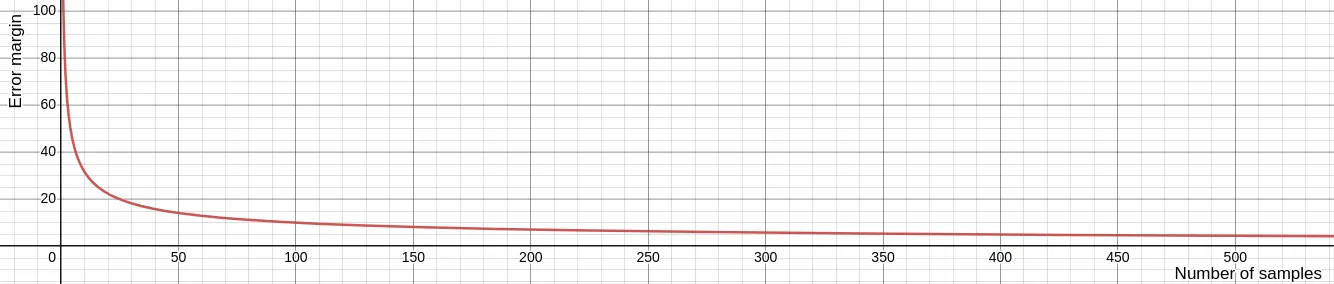
That’s actually why the rule of thumb is “the more data, the more accurate the results are”, because the error margin decrease with the volume of data you test your OCR with, and coverage to an acceptable rate from 1.000 data in your test set. This is how the error margin evolves while increasing the number of test data:
To summarize:
- We suggest having at least 1.000 data in your test set in order to get an accuracy evaluation ~3% close to reality.
- If you don’t have this amount of data, take care of calculating the error of measure to try and draw conclusions taking this approximation into account.
But this is not done yet. It’s not enough to take 1.000 receipts to get an acceptable estimation of the accuracy of the OCR. This formula works under one very important constraint: The data used for measuring the performances must fit the same distribution as your real flow of receipts. In other words, you should select data that represents well the data you will use the OCR on a large scale.
How to select the receipts to use for testing the OCR?
Again, this is a complicated problem, but solutions exist. As we have seen in the last section, in order to understand how accurate our measure is, we can compute the error margin, but this works only if the test set corresponds to data within your real receipts distribution. If you don’t do that, the error margin formula is just not valid anymore, and you can’t make any conclusion about your measure.
To illustrate this problem, let’s assume that you have 98% of US restaurant receipts and 2% of German parking receipts in your real flow of receipts. Does it make sense to test the receipt OCR using 50% of Italian hotel receipts and 50% of Canadian Restaurant receipts? It does not, and the problem is the data distribution. You are not testing the solution in the same conditions as your real flow and thus, the accuracy measurement will be extremely inaccurate.
Statistically speaking, the definition of data distribution in the context of images such as receipts is not obvious. Images are very high dimensions data and finding a linear space in which you make sure the distributions fit is tedious. But there are easy ways to select the data that don’t require much science and are pretty intuitive:
Random choice within your real receipts flow
Choosing randomly your test set can be done only if you already are collecting receipts, and if you want to use the OCR on the same flow. For example, if you are building an expense management mobile application and are already collecting receipts from your users, randomly choosing receipts sent to this application works only if you want to integrate your OCR into this application. If you are using the receipts from this application in order to evaluate the OCR for another usage, an Accounts Payable module, for example, you will most likely not fit the distribution and your measurement is biased.
Criteria-based choice within a receipts database
You might have a receipt database, but don’t have a production flow yet. Because you are not storing your user’s receipts, or because you haven’t launched your app yet. In that case, you can define criteria on the receipts and anticipate your future flow. If you are launching a US-based expense management software, targeting traveling salespeople in the US, you can anticipate that most of the expenses will be about restaurants, hotels, tolls, and parking. You also know that receipts are going to be issued by US merchants. Those criteria help you focus on testing the OCR on the right type of receipts. But it’s still important to be very careful and keep in mind that it’s not your real flow of data and thus, there is a bias in the performances that will be computed.
Once you have your data set selected, it’s important to keep the images unmodified. You might be tempted to add blur, reduce the quality, or obfuscate some text, but by doing that you are actually changing the distribution of the data and thus adding bias, making your benchmark irrelevant or innacurate. If you found your test set on the internet, or another source that doesn’t ensure the images were not modified, take a look at them and remove them from your test set if they contain artifacts like watermarks or digitally added text.
How to annotate the receipts?
Data annotation is the last crucial step before performing the benchmark. This is a tedious task and setting up your annotations guidelines is very important not to waste time.
Why annotate data?
Computing the extraction performances of the OCR is actually comparing the data extracted by the OCR with the ground truth. We could do a manual process, and send data manually one by one in the OCR using a UI to see if the extraction is well done or not. But this would be a subjective judgment, and it’s very important to stay unbiased and objective during the process.
Data annotation is the last step before running the benchmark and having a CSV file or a spreadsheet with all the real values of each important field for each receipt will allow us to:
- Make sure there is no error in our comparisons between ground truth and OCR extractions
- Measure different metrics
- Identify error patterns
Define the important receipts fields and their formats
First, you need to define exactly what fields you want to test the receipt OCR on, and for each field, design a pattern that can be easily used for comparison, because remember that the idea is to automate the comparison process.
For example, if you want to test the performances of the OCR on the date field, you want to make sure your annotations are easily comparable. If the receipt OCR returns dates in an ISO format (yyyy-mm-dd), it’s important to annotate your data in the same format.
Generally speaking, if you have a doubt, following rules that are close to code formats or ISO formats is a good practice to ensure you don’t introduce confusion in your annotations, and that the format can be always compared to OCR outputs.
In order to make sure you can easily compare the annotations with the OCR outputs, here is a list of commonly used data formats easily usable for main fields:
- Dates: “2022-01-14” - “yyyy-mm-dd” ISO 8601 format
- Currencies: “USD” - ISO 4217 format
- Amounts: “138.44” - no comma separation for thousands, a dot for the decimal separation
- Rates: “0.20” for “20%” - the rate
- Time: “14:32” - “hh:mm” [ISO 8601 format](https://en.wikipedia.org/wiki/ISO_8601#:~:text=As of ISO 8601-1,minute between 00 and 59.)
- Text field like Merchant: “Amazon” - The raw text as written in the document
For fields that are a variable-length list of items, it’s a bit more complicated. Let’s think for example about taxes breakdown. On some receipts, you can have none, one or multiple lines of tax, each of them including a rate, an amount, a base, and a code for instance. The problem is that you might not be able to know how many of such lines will be included in a receipt in advance. Moreover, being able to know what amount is associated with what rate is important.
There are many possibilities for that, one requiring code when we’ll compute the results, the other one not requiring code but a little more tedious.
- If you plan to have a developer coding a script to compute the performances in the end: You can design a pattern that will be easily parsed using code. For example “0.20 / VAT / 21.48 | 0.10 / VAT / 12.48”. Adding the separator “/” between each field, and the separator “|” between each line will make sure the developer can split the annotations using those separators and retrieve the values for each field of each item.
- If you want to use only a spreadsheet for computing the performances, it’s also possible. But it requires adding columns for each field of each item and defining the maximum length of your variable list. Moreover, you need to define a reading order (top to bottom for example) because you will compare cells statically annotated in the end. In our tax example, we could define that there are no more than 4 items per receipt, and add columns with headers tax_rate_1, tax_amount_1, tax_code_1, tax_rate_2 etc…
In our example, we’ll perform the receipt OCR benchmark on the following fields:
- Total paid: “138.44” - no comma separation for thousands, a dot for the decimal separation
- Total tax: “11.14” - no comma separation for thousands, a dot for the decimal separation
- Receipt date: “2022-01-14” - “yyyy-mm-dd” ISO 8601 format
- Issued time: “14:32” - “hh:mm” [ISO 8601 format](https://en.wikipedia.org/wiki/ISO_8601#:~:text=As of ISO 8601-1,minute between 00 and 59.)
- Currency: “USD” - ISO 4217 format
- Merchant: “Amazon” - The raw text as written in the document
- Tax items (we’ll use the spreadsheet-only scenario):
- Tax rate: “0.20” for “20%” - the rate
- Tax amount: “138.44” - no comma separation for thousands, a dot for the decimal separation
- Tax code: “City Tax” - The raw text as written in the document
The different tools for OCR annotation
We have drafted the list of receipt fields we are interested in, and the format for each of them in our annotation plan, the critical but not so funny part starts now.
The value of this part doesn’t actually rely only on getting our annotations done and enabling the benchmark. Seeing examples, and annotating them is actually very helpful to anticipate your future users’ questions, and will make you a pro of your topic. While annotating, you are going to understand your data, find out edge cases and potential problems of definitions, identify patterns, etc… Because of that, as a product manager, doing part of the annotation can be very insightful for the future and give you a very deep understanding of your application.
First, you need to select the right tool to annotate your receipts efficiently. Here are a few options:
Directly using the spreadsheet
Pros: Easy to set up, no code required
Cons: Not optimized for data annotation, complicated to do more than 100 receipts
This is probably the less optimized way for annotating your receipts, but it’s also the easiest to set up. If you have a small data set, this solution can work, if you want to annotate more than 100 receipts, this gets tedious.
The process is quite simple, for each file in the spreadsheet, add a line with the filename, and the fields you want to compute your benchmark on in the right column.
The good thing about this is that you won’t have to process the results as you might have to do using another tool because it’s already in the benchmark spreadsheet.
Using an open source annotation tool
Pros: Free, Optimized annotation process thanks to the user interface
Cons: Requires coding skills to set up the interface and process the results
Tools like Github can be very useful. Once the tool is set up on your machine, and you have understood how to use it, the process can be efficient thanks to its user interface. The main problem is that you need some coding skills to launch it on your machine. Moreover, the annotations come in a standard structured format but might not fit exactly an easy format that can be inputted into the spreadsheet without coding.
Using a paying software
Pros: Optimized annotation process thanks to the user interface, easy output format
Cons: Paying, and sometimes requires setup
This includes all the features that are required to do an efficient annotation process. The main drawback is that most of these products target enterprise customers and are interested in large-scale usage. That means they are expensive, and they might not be interested in your project, because you are annotating only a few thousand pieces of data.
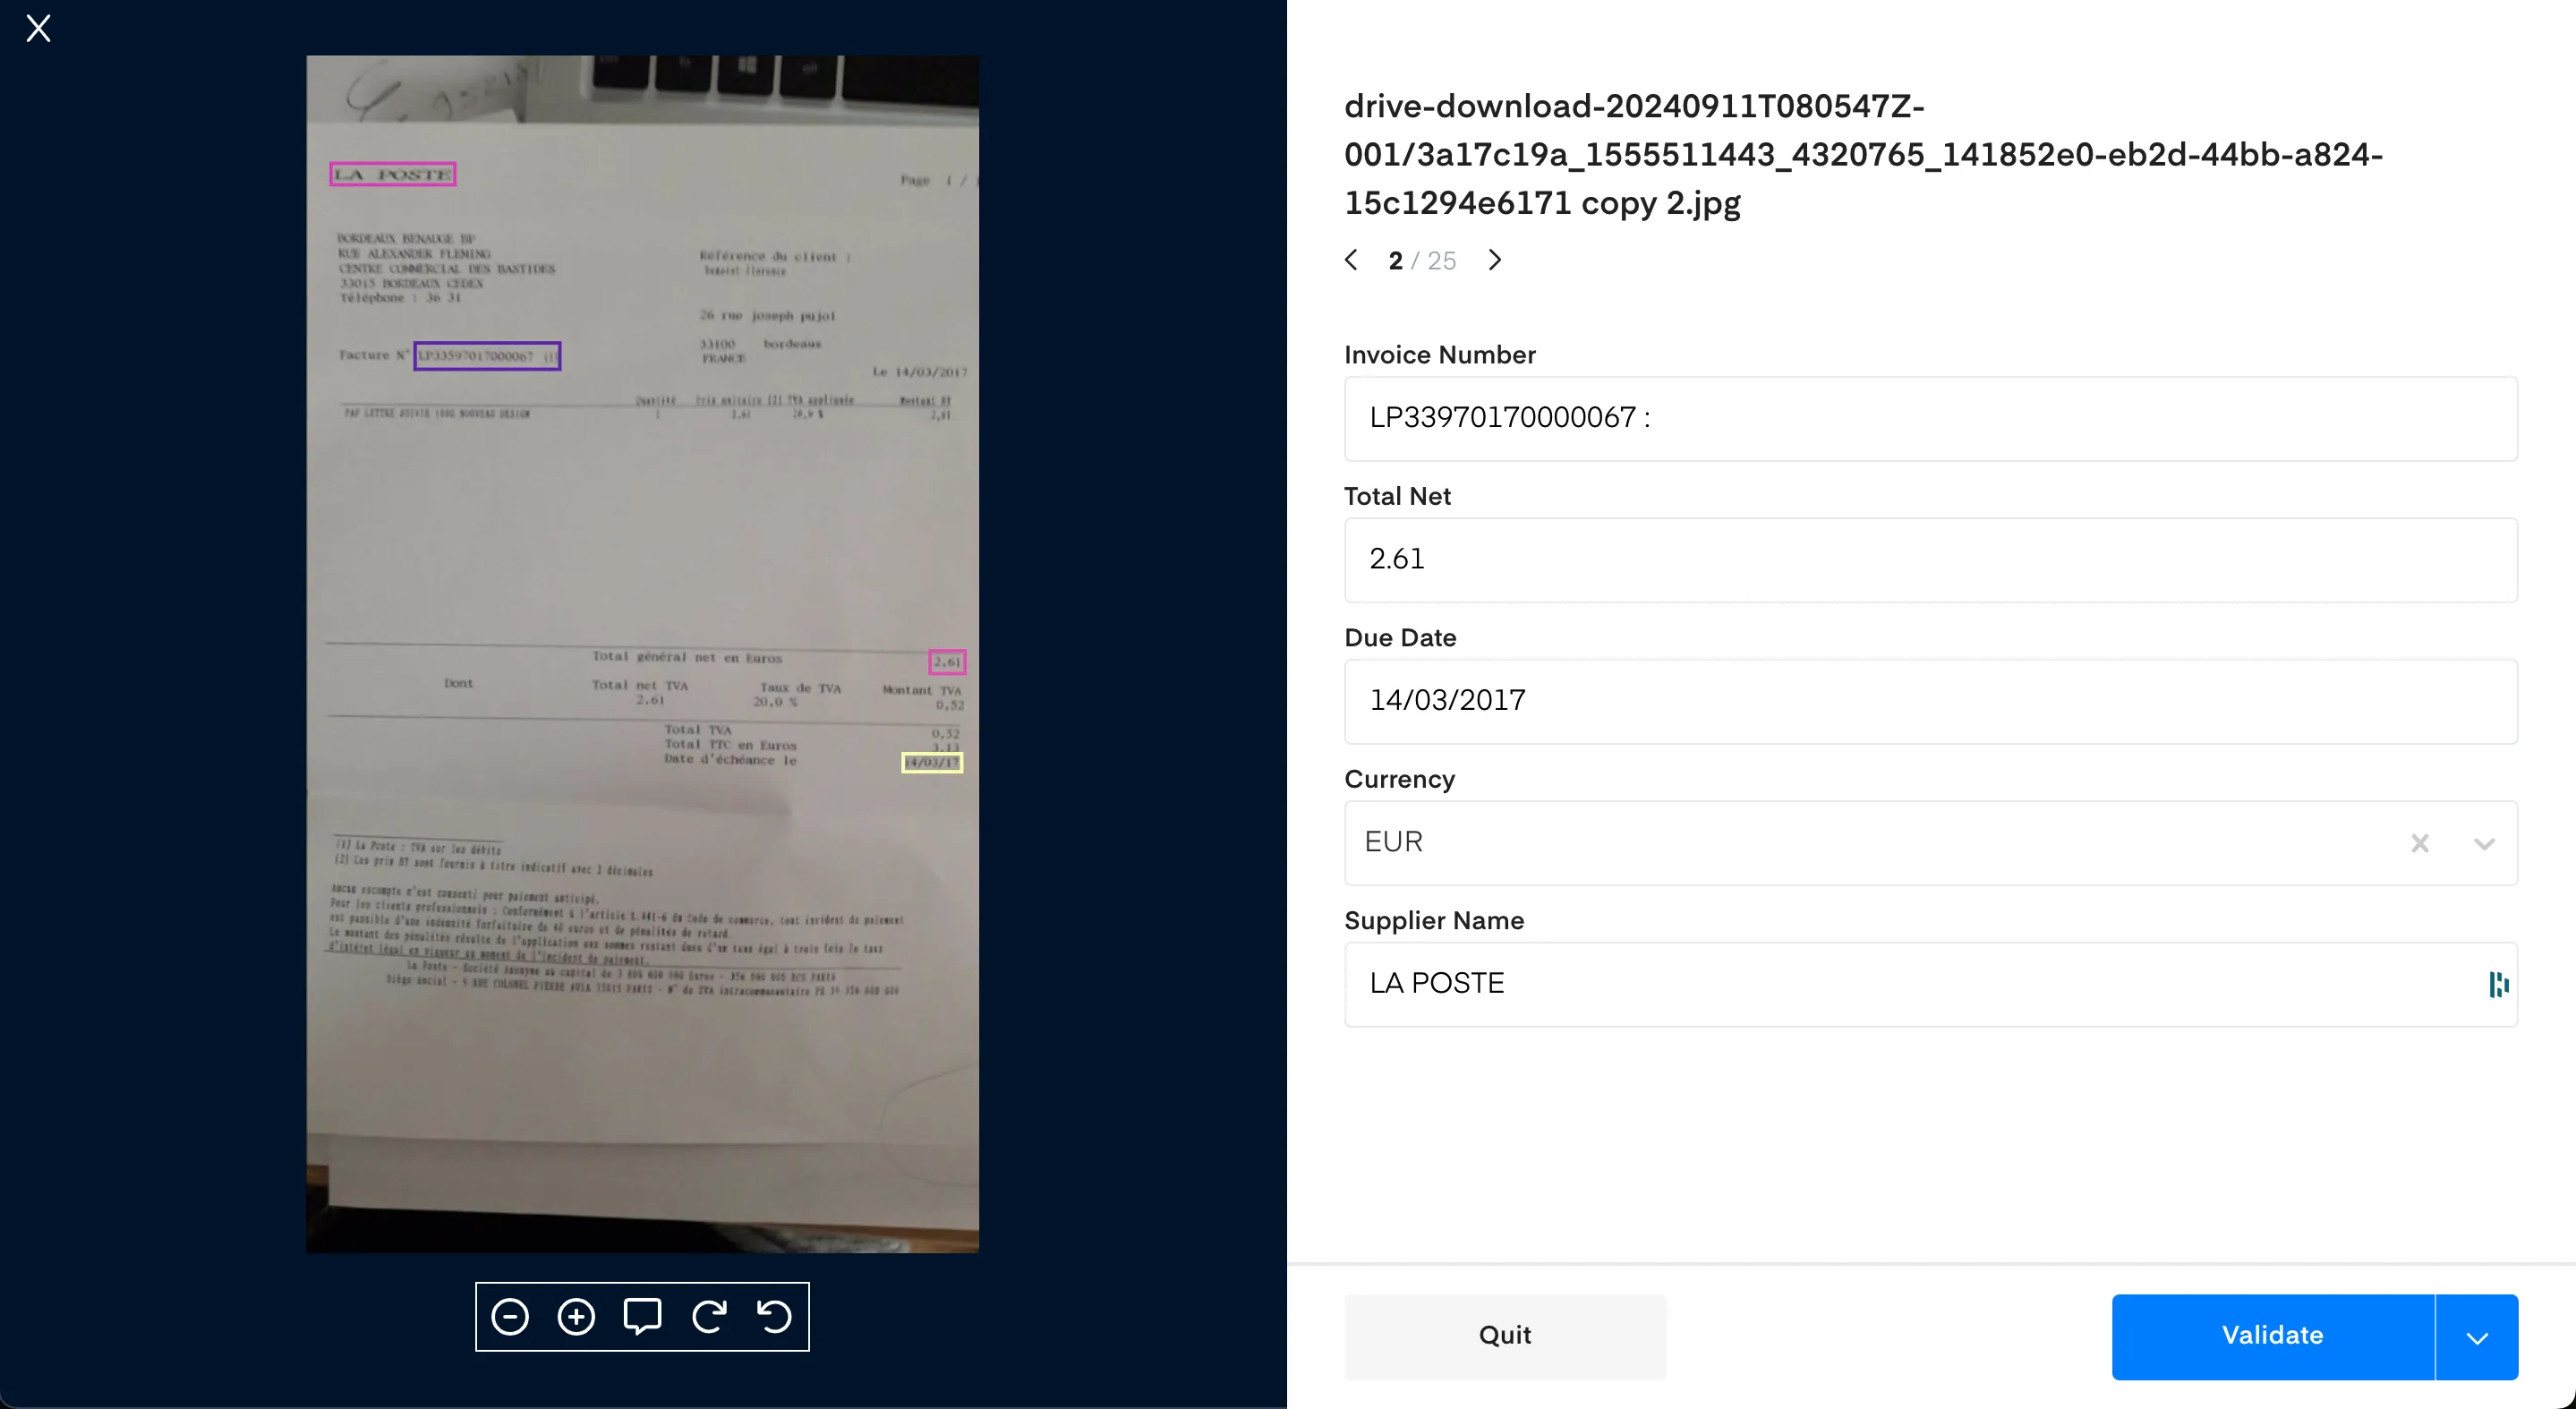
Using Mindee
We couldn’t find any free and optimized annotation tool for receipts and documents. We decided then to develop this tool to help our customers and teams be efficient to annotate receipts, invoices, or any type of document. It’s completely free and can cover most of your document annotation use cases. If you want to get access to it, just reach out to the chat and we’ll set up your account.
Whatever solution you decided to use, the final deliverable of this phase is to gather the annotations in a usable format for your benchmark tool. In our example using the spreadsheet, you have to see one line for each file, along with the annotated fields for each of them. Make sure you validate the last time your file to ensure you didn’t mix filenames with annotations for example, and we’re ready to go to the next step.
Performing the receipt OCR benchmark
Now that you have your receipts annotated, we need to compare the results of the receipt OCR to your annotations. To do so, we will define a few metrics that can be relevant for your use case, along with their business value.
Click below to download Mindee's free OCR benchmark tool and start your evaluation today!
Download the Free OCR Benchmark Tool
What metrics to use?
Extracting data from receipts using an OCR is not an end in itself. Some use cases of the OCR can be for example:
- Automatically fill a form that will be validated by your users, without the hassle of retrieving all the information themselves on the raw receipts.
- Fully automate a process that requires data from receipt images without any human touch.
- Gather data from a database of receipts in order to extract insights from the types of purchases.
Depending on the use case, the metrics to compute can differ because their business value is different. We’ll try to define a few important metrics and explain how they can be transcribed into business value in the following sections.
Document-level vs field-level metrics
Before diving into the metrics, let’s define two important scopes that should be considered to compute the metrics. The goal is to make a distinction between a correct answer for the full receipt, or for a field in the receipt.
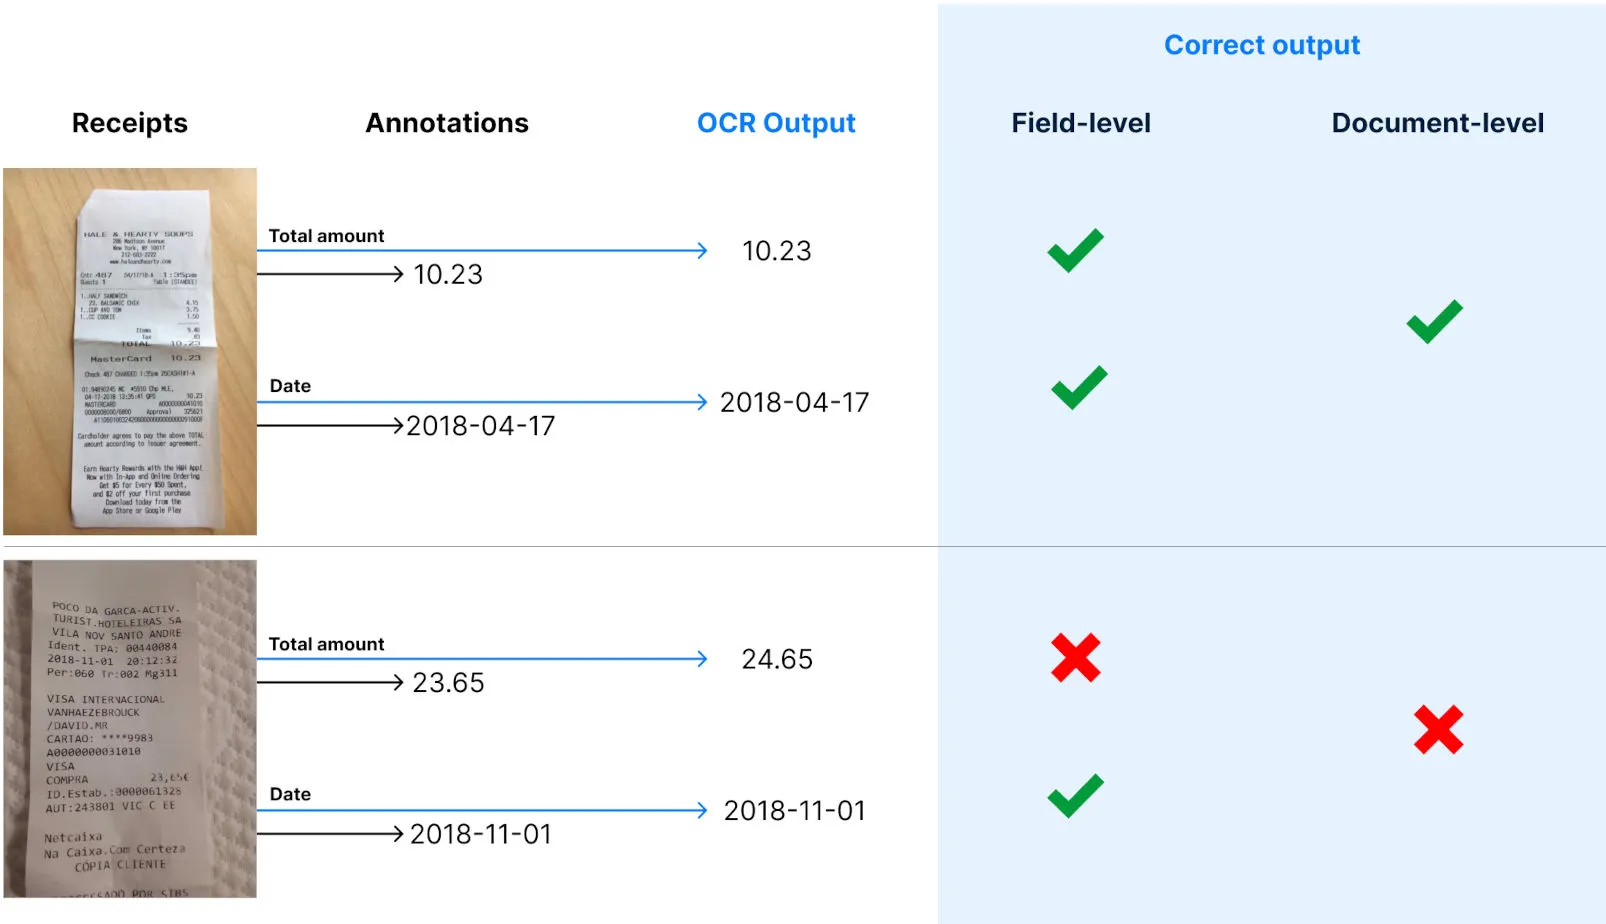
Document-level refers to a correct output for the full document, meaning that all the outputs of each field are correct.
Field-level is more granular and corresponds to a unique field inside a document being correctly outputted by the OCR.
Accuracy
Accuracy is probably the most common metric used in statistics to compute the performances of algorithms. It’s also the easiest to understand. It’s merely the percentage of right predictions (OCR outputs) on a data set.
Example: You have a test set containing 1000 receipts that fit your real data distribution, and you are trying to compute the accuracy of the OCR receipt on the field Total amount. If the OCR outputted 861 right answers on the 1000 receipts, the accuracy is of 86.1%. 1000 data for testing corresponds to an error margin of 3.2%. You can conclude that with a confidence of 95%, the accuracy of the OCR on the total amount extraction will be between 82.9% and 89.3%.
What does it mean in your use case?
At the field level, we consider the OCR output correct if it’s equal to the annotated field.
- If your use case is the pre-completion of a form that will be validated by a user, this is the average number of corrections that your users will have to do in this field in order to get accurate data. In other words, if you think that correcting a field takes 12 seconds, you can put a time value on top of the field-level accuracy for each field.
- If your use case is a full automation task without humans in the loop, the field-level accuracy can help you figure out what fields are the bottlenecks to improve your document-level accuracy and take action on that to optimize the results. For example, if your flow requires automating the extraction of the date and the total amount, and you have a field-level accuracy of resp. 74% and 94%, you know that your document-level accuracy and thus your automation rate cannot be higher than 74%.
At the document level, we consider the OCR output correct if all the fields you are interested in are correct at the field level. The accuracy, in that case, is the proportion of receipts that will be fully correctly extracted.
- If your use case is the pre-completion of a form that will be validated by a user, this is the proportion of receipts your users won’t have to correct anything on. In other words, the rest of the receipts will require an action from your user to correct extraction.
- If your use case is a full automation task without humans in the loop, the document level accuracy is simply the correct automation rate. The outputs that contain an error (100% - document level accuracy) are very dangerous because they all contain an error, and thus can lead to automation based on bad data. In order to make sure the correct automation rate is high, precision is a better metric.
Precision
Accuracy and precision are two confusing words, that don’t have the same meaning at all in statistics. While accuracy is a proxy to answer the question “What’s the percentage of right answers?”, precision answers the question “When the OCR outputs something, what’s the percentage of right outputs?”. It looks very similar to the accuracy, and it’s indeed correlated to it. But as we are going to see, it doesn’t have the same meaning.
To compute the precision, you need to compute the proportion of right answers but not on your full data set, only on the sub-sample of it on which the OCR outputted a non-null value.
Example: You have 1000 data in your test set and you are trying to compute the precision of the OCR on the field total amount. The OCR outputted a value for the total amount on 914 receipts and returned a null value for the others. Among those 914 receipts, the total amount was correctly extracted for 861 of them. Your precision is then 861 / 914 = 94.2%. The error margin is 3.2% with 1000 data, you can then conclude that with a confidence of 95% the precision of the OCR on the field total amount is between 91% and 97.4%.
As you can see, precision and accuracy are similar but very different. It’s possible to have a precision of 100%, with an accuracy of 0.1%.
In your use cases, the precision can be insightful:
At the field level
- If your use case is the pre-completion of a form that will be validated by a user, the precision corresponds to the number of times that there will be an auto-completion for that field, and the auto-completion is correct. If the OCR is very precise, the user won’t be able to do mistakes because the field will not be filled at all when there is an error, and the user cannot skip it. Besides, it’s easier to correct a field that is empty, than correct a field that has already something in it. A higher precision at the field level also has a time value because correcting one field is faster.
- If your use case is a full automation task without humans in the loop, the field-level precision doesn’t give much information, but like the field-level accuracy, it can give insights about the fields that are the bottlenecks for the document-level metric.
At the document level
- If your use case is the pre-completion of a form that will be validated by a user, the document-level precision isn’t very insightful. This corresponds to the percentage of receipts on which the users will have to fill the form’s fields only when they are empty, and thus won’t have to correct auto-completed fields. But, you can measure the amount of time required for the two cases, and there can be still an interesting amount of time spared for correcting empty fields vs wrongly auto-completed fields.
- If your use case is a full automation task without humans in the loop, document-level precision is critical. For those use cases, we prefer when the OCR doesn’t output anything rather than when it returns an incorrect answer, because everything is automated and the process will go on with bad data. For this reason, the accuracy is not very important, because you will very likely reject a prediction that contains a null value because you know in advance that you don’t have all your required fields and that would lead to an error. Because the next step of your automated process can be very dangerous with bad data, the document-level precision gives you the percentage of wrong data that will be used in the automated flow. Let’s take the example of an Account Payable Automation use case. You gather invoices in your application and try to fully automate their payment of them. Having a 91% document-level precision means that your customers will pay, 9% of the time, an amount that is not the correct invoice amount. This is obviously impossible, and getting as close to 100% as possible is crucial.
Conclusion
Here is a summary of the best practices to keep in mind when you’ll test a receipt OCR technology:
About data
- 1.000 data in your test set will give you a 95% confident approximation of the accuracy with a 3% error margin. If you don’t have 1.000 receipts, compute the error margin formula to understand how accurate is your benchmark.
- Select data that fits your real-world problem. If you don’t have yet a production flow, or if it’s hard to do that automatically, try to extract patterns in your data that help you build the test set (Example: countries, currencies, type of expenses, dates, etc…)
- Do at least 2 rounds of data annotation before measuring the performances because the impacts of wrong annotations can be very important.
About
.svg)